At the end of the 3 days of the Cloudfest Hackathon 2025, the Visua11y Infographic Plugin is ready to be tested.
How the magic happens
Once the Visua11y Infographic block is added, users can select an infographic image from their media library or upload a new one to be processed.
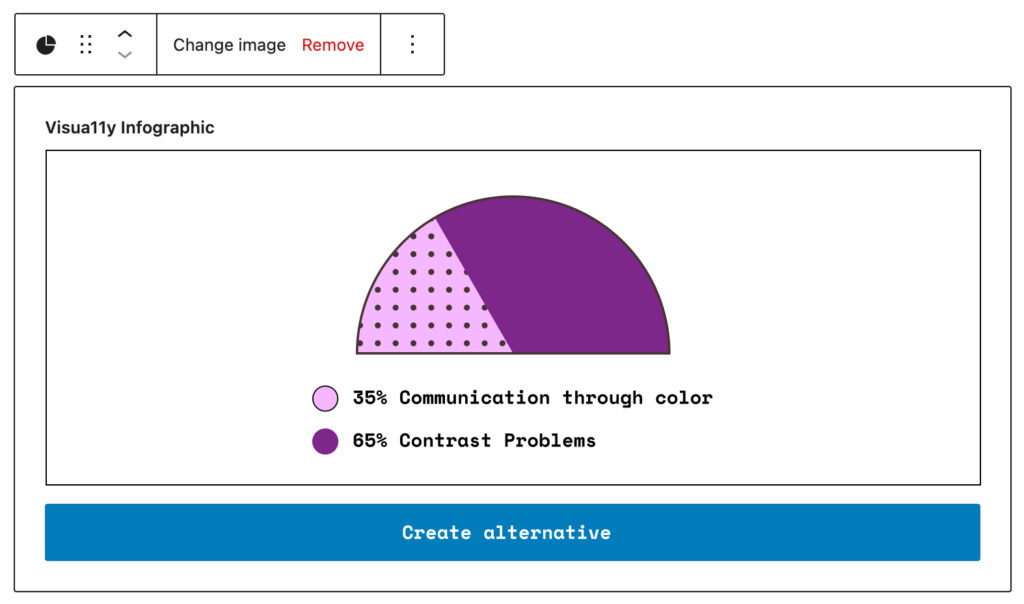
4. After uploading the image, Click the Create alternative Button. The Visua11y Infographic plugin generates a detailed, structured description of the infographic using a custom AI-powered prompt. This description includes a summary, HTML tables, and other relevant content to ensure clarity and accessibility.
Below you can find in action how the generated alternative looks like after uploaded a infographic.
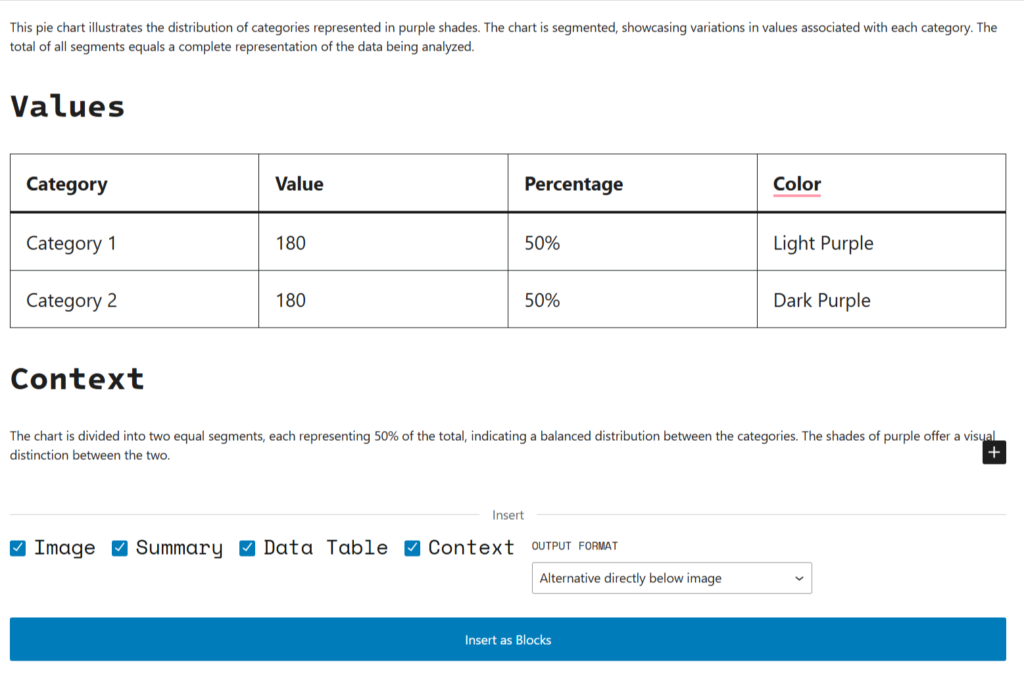
Below, it can be found how the alternative for the infographic is displayed, including Summary, Context and Values, in a block layout.
Accessible alternative for the infographic
Summary
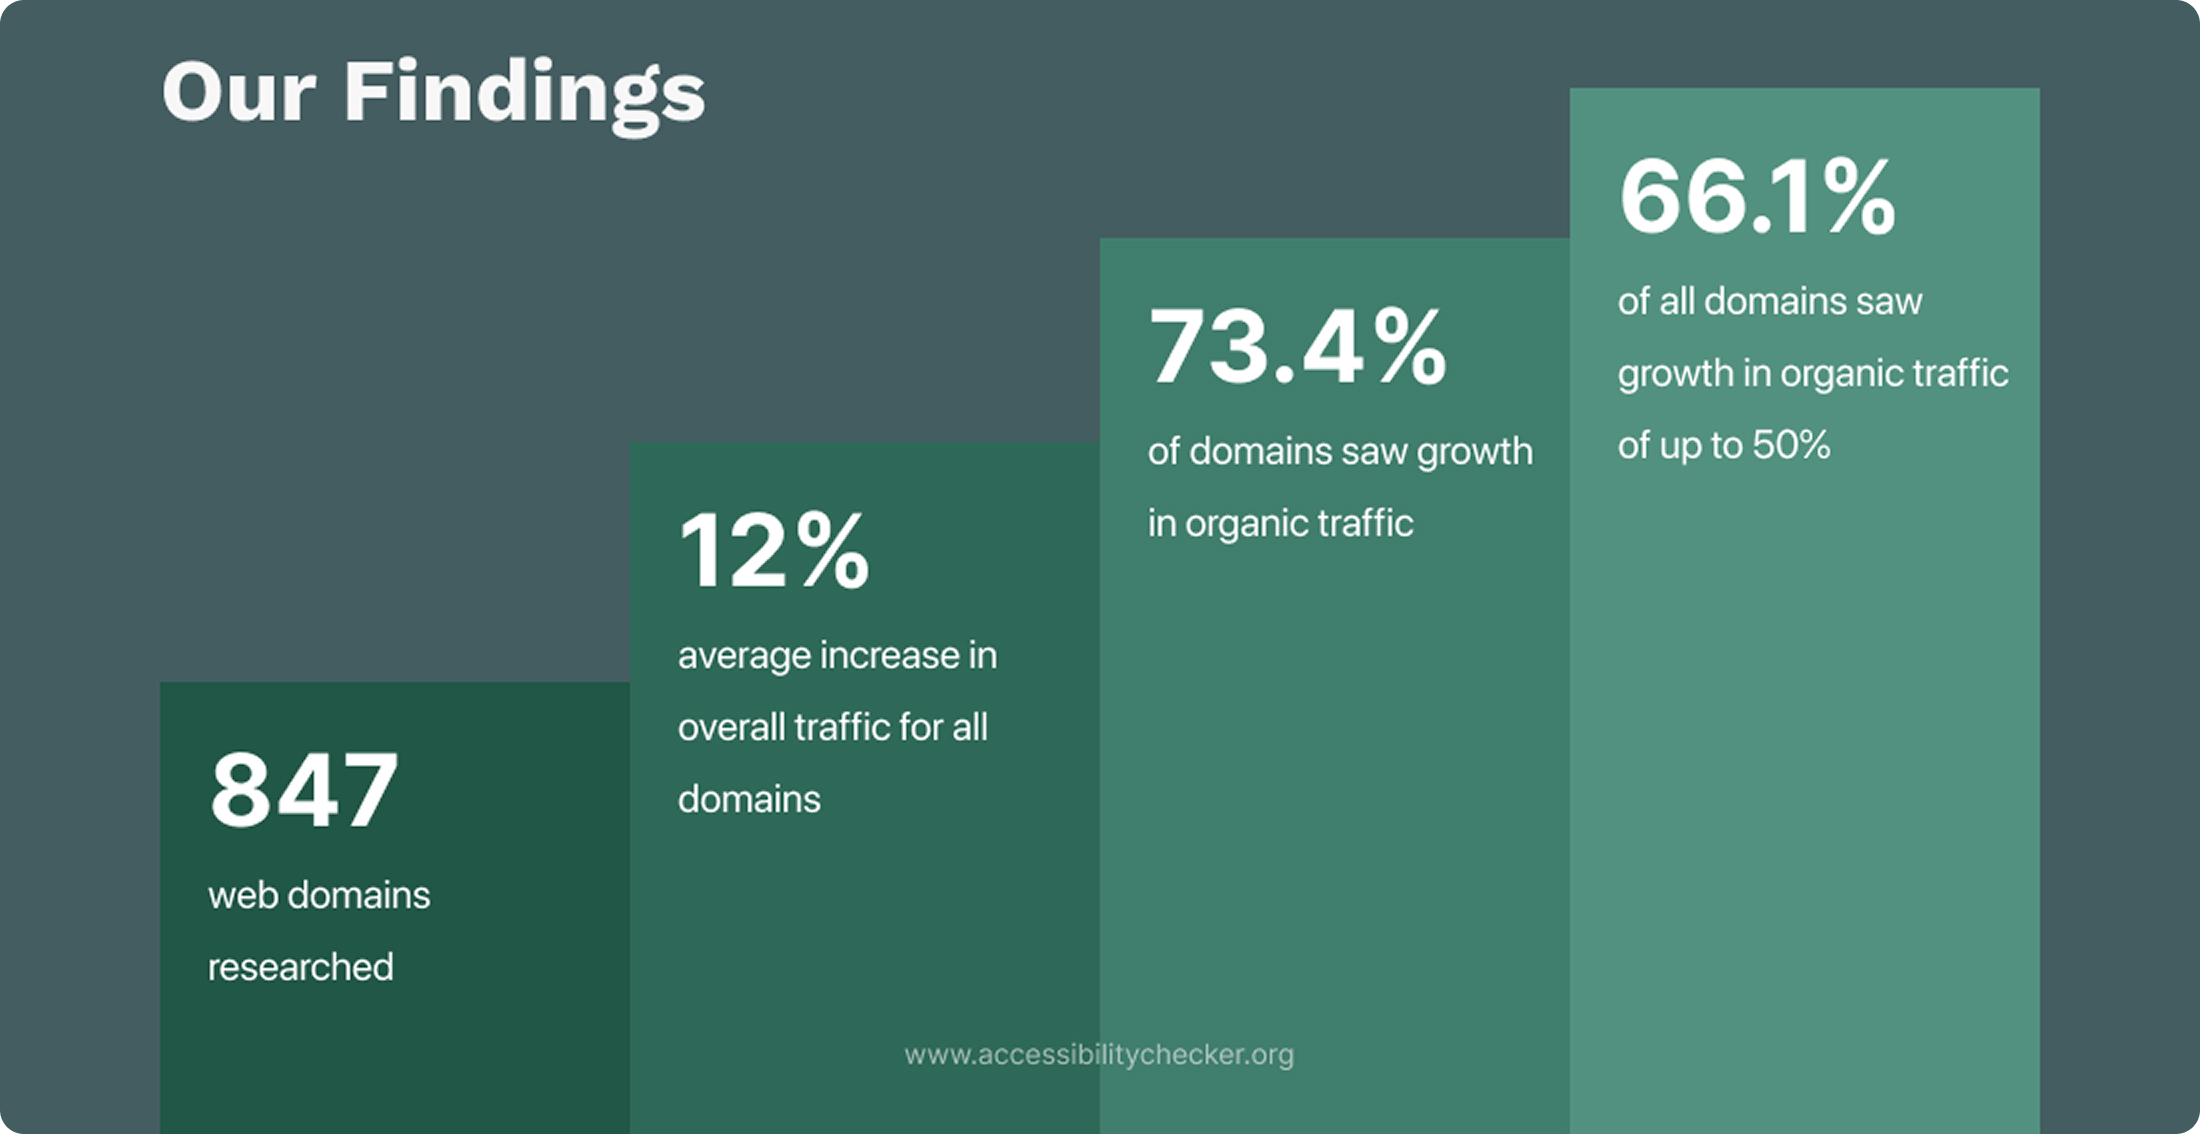
This bar chart presents findings from research on web domains, highlighting key statistics related to traffic changes. It indicates that a total of 847 web domains were researched. The chart shows a 12% average increase in overall traffic across all domains. Additionally, 73.4% of the domains experienced growth in organic traffic, while 66.1% saw this growth reach up to 50%. These insights suggest overall positive trends in web traffic for the analyzed domains.
Values
| Finding | Percentage or Total |
|---|---|
| Web domains researched | 847 |
| Average increase in overall traffic | 12% |
| Domains with growth in organic traffic | 73.4% |
| Domains with growth up to 50% | 66.1% |
Context
The bar chart effectively uses varying heights to represent the different statistics, providing a clear visual comparison of each finding. The first bar represents the total number of web domains, followed by bars illustrating the percentage increase in overall traffic and the proportions of domains experiencing organic traffic growth.
Video Demo
Video Description: In a page, the Visua11y Infographic is added. It generates the semantic outputs that can be found under the image.