Many websites and online shops use infographics to present key information — such as product details, sizing charts, and safety instructions — but these complex visuals are not accessible for assistive technologies by default. Without alternative text or structured data, screen readers cannot understand the content, preventing many users from accessing essential information.
The Visua11y – Accessible Infographics project tackles this issue by developing a WordPress plugin, that integrates with the block editor, enabling automatic extraction and structuring of infographic data. This tool is aimed to empower website visitors, offering an inclusive experience for complex infographics, so that that all users, regardless of ability, can access essential information.
How the team is working
Our team split into different groups to tackle development, marketing, and documentation. The dev team is integrating the plugin into WordPress as a block editor that helps to output the data in an accessible way.
For this year’s MVP, we’ve narrowed the scope to statistical infographics — specifically pie charts and bar diagrams. The plugin is trained to identify these two types of graphics and extract accurate, structured data.
How will the plugin work?
With Visua11y Infographic, users can add a dedicated block to their post or page, upload an infographic, and let the plugin generate a structured, accessible description.
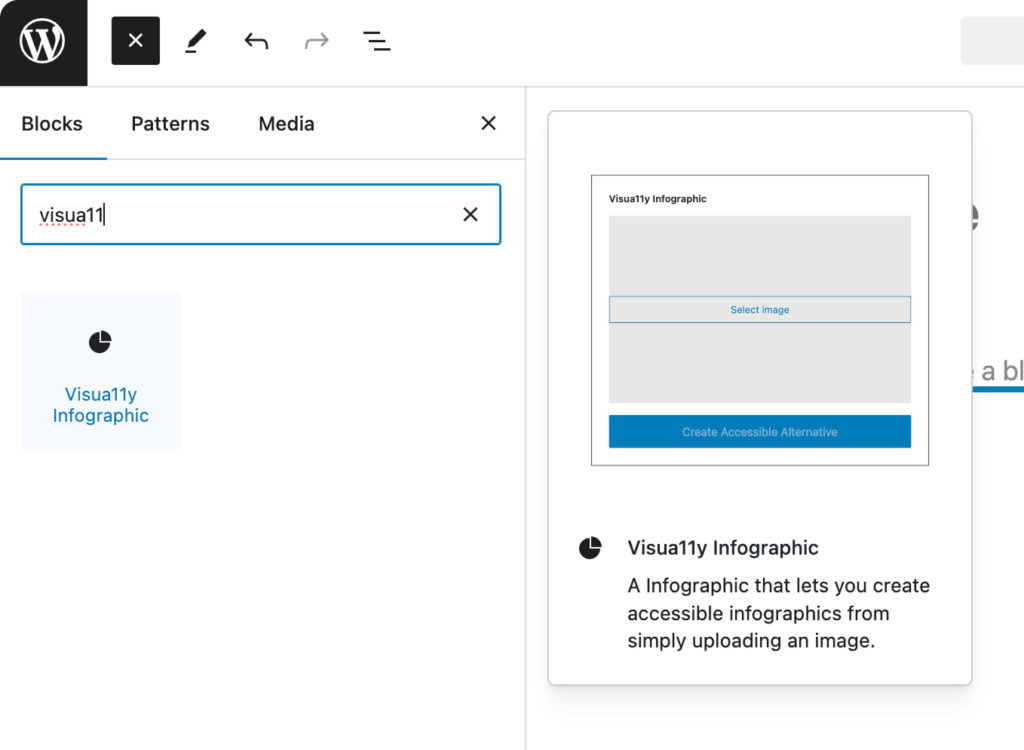
- Users can insert a dedicated block named Visua11y Infographic into their page or post using the block editor.
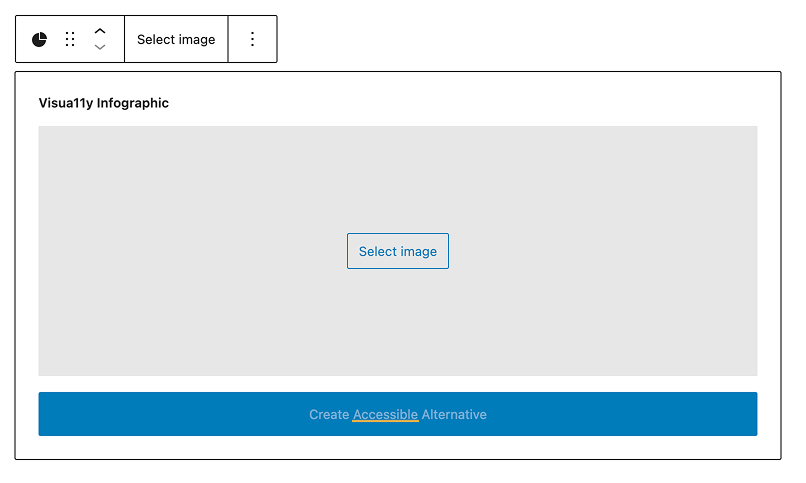
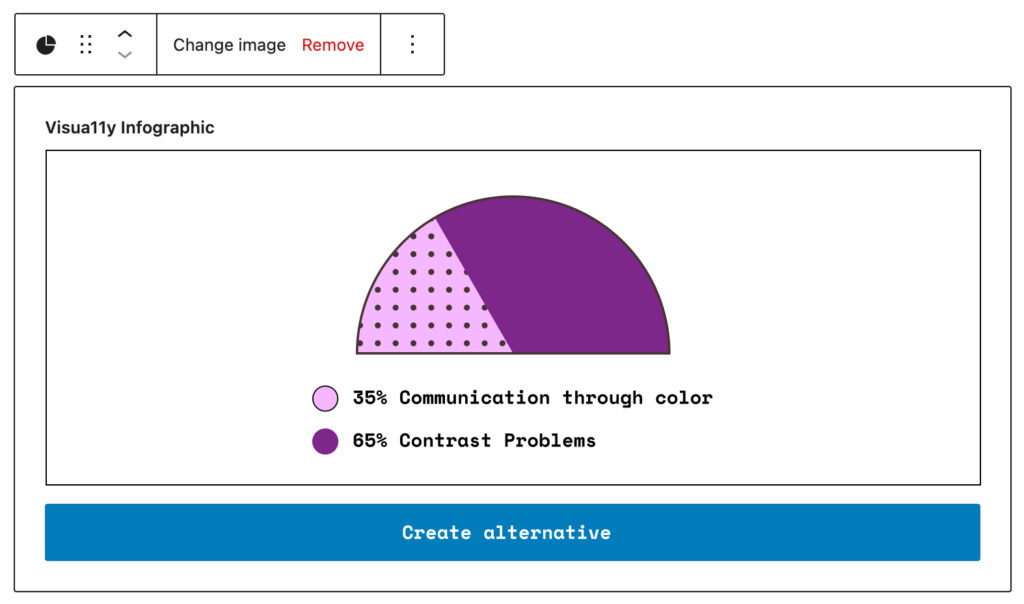
- Once the Visua11y Infographic block is added, users can select an infographic image from their media library or upload a new one to be processed.
- The Visua11y Infographic plugin generates a detailed, structured description of the infographic using a custom AI-powered prompt. This description includes a summary, HTML tables, and other relevant content to ensure clarity and accessibility.
- The generated content is inserted into the block editor as native WordPress blocks, allowing users to edit, rearrange, or style the elements just like any other content.
- The original infographic image is also included in the post and is automatically linked to its rich description using aria-describedby and a unique id.
Project status at the end of Day 1
- The concept for training the algorithm was finished;
- Also, the design of the block editor was created;
- The image block editor was setup;
- The back-end part was ready;
- The technical documentation for the back-end is already work-in-progress.
A few screenshots of the front-end part of the Visua11y plugin
Step 1: Install the Visua11y Infographic Plugin

Step 2: Find the Visua11y Infographic Block in the Core Editor

Step 3: The Visua11y Infographic Block is added

Step 4: A Graphic image is added into the block editor

What’s next?
The dev team will work on the Front-End / BackEnd Integration, Testing and Documentation of the plugin.
Some important aspects to be taken into account:
- Taking care of the ethical part of disability inclusion for open source analysis images;
- Ideas for covering costs (API credits) and finding Funds;
- Documentation for the End User.