Version: 0.1.0
Category: Media
License: GPL-2.0-or-later
Text Domain: visua11y-infographic
Overview
The Visua11y Infographic plugin is a WordPress block that empowers users to create accessible infographics by uploading or selecting an image file. Leveraging AI via a custom API, the plugin generates a comprehensive, accessible alternative for the infographic, which includes a detailed summary, a data table, and contextual information.
This plugin is designed to make infographics accessible to visually impaired users by providing a textual representation that describes the content of the image in a format that is easy to understand.
The Proof of concept after the Cloudfest Hackathon 2025 covers only these 2 types of infographics:
- pie charts
- bar charts
The Visua11y WP Block Plugin will be available soon for downloading.
Features
- Upload and Analyze Infographics: The user uploads or selects an infographic image. The plugin then uses a custom API, powered by AI, to analyze the content of the image.
- Generate Accessible Alternative: The API generates a detailed accessible alternative for the infographic. The result includes:
- Summary: A textual description summarizing the image.
- Data Table: A table containing all the values from the infographic.
- Context Description: A contextual description of the image.
- Edit and Customize: The user can edit the generated content, deciding which elements (summary, data, context) to include or exclude.
- Format Selection: The plugin offers three formats for presenting the alternative:
- Default: As a group below the content.
- Details Block: As a collapsible details block below the content.
- Columns: As columns next to each other for side-by-side display.
- Core Block Integration: When inserting the accessible alternative as core blocks, the plugin:
- Inserts the original image with an
aria-describedbyattribute. - Links the
aria-describedbyattribute to an anchor in the generated accessible alternative. - This setup allows visually impaired users to better understand the image by reading the detailed alternative content.
- Inserts the original image with an
- Extension of Core Image Block: The plugin extends the core WordPress image block by adding an
aria-describedbyattribute to the image, linking it to the generated accessible alternative.
Installation and Usage
- Upload – install – activate the plugin

2. Once the Visua11y Infographic plugin is added, the block Visua11y Infographic will be available to be added in the post / page / any custom post type using blocks.
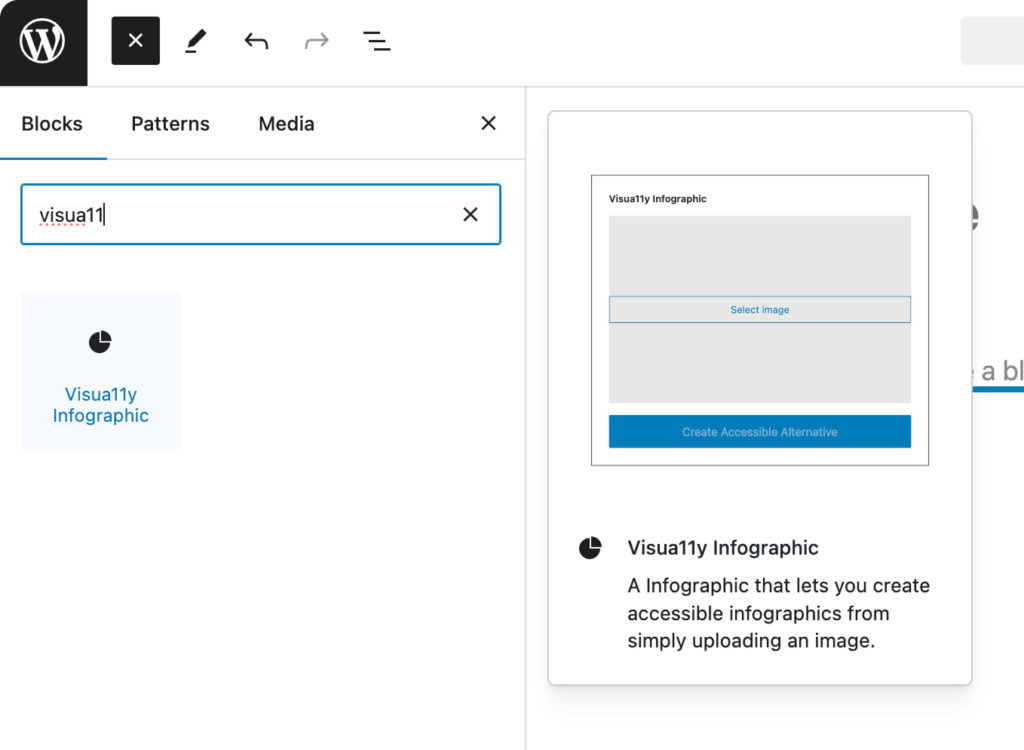
3. Once the Visua11y Infographic block is added, users can select an infographic image from their media library or upload a new one to be processed.
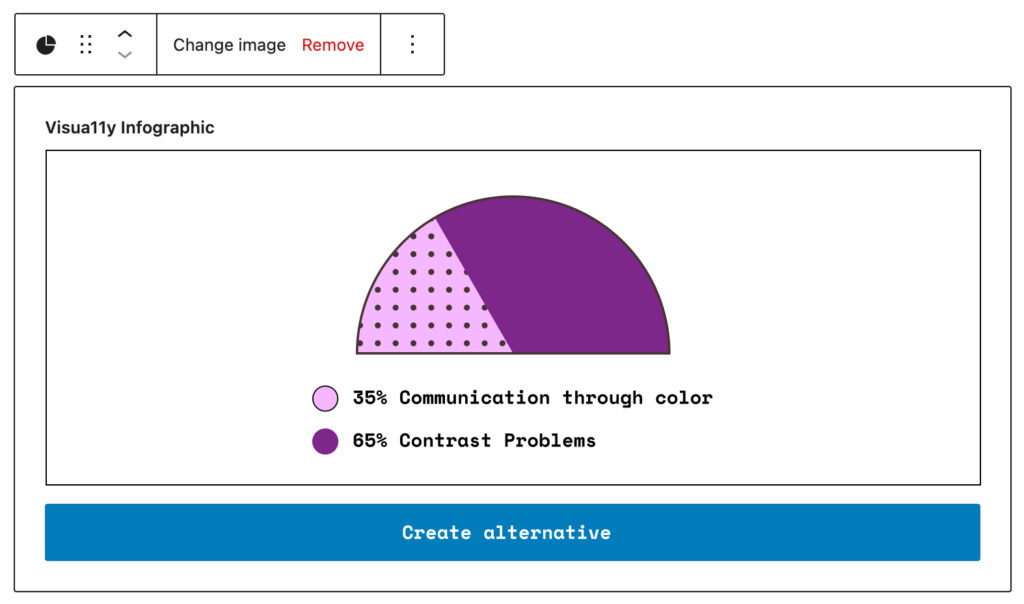
4. After uploading the image, Click the Create alternative Button. The Visua11y Infographic plugin generates a detailed, structured description of the infographic using a custom AI-powered prompt. This description includes a summary, HTML tables, and other relevant content to ensure clarity and accessibility.
Below you can find in action how the generated alternative looks like after uploaded a infographic.
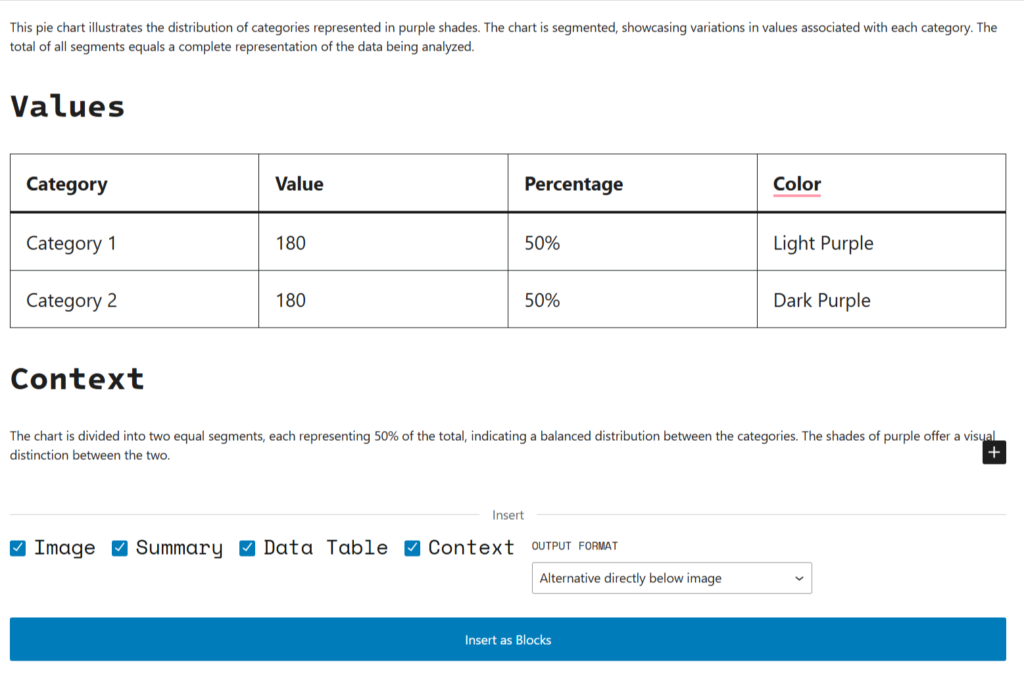
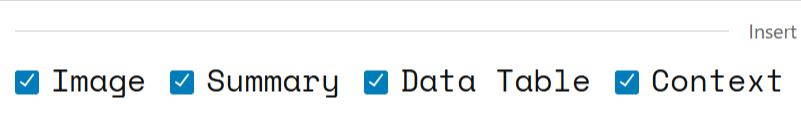
5a. The semantic output can be chosen in a checklist, with the options: with the options: Image, Summary, Data Table, Context
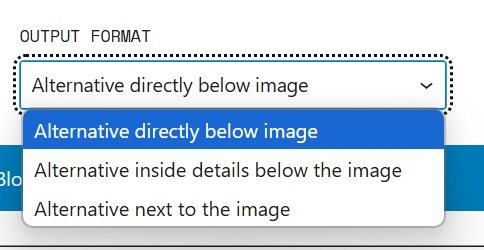
5b. The output format can be chosen in a dropdown menu
- Alternative directly below image
- Alternative inside details below the image
- Altenative next to image.
6. Enhance Accessibility: The added aria-describedby attribute improves accessibility by ensuring that screen readers can link the image to its detailed accessible description, giving visually impaired users the context they need.
Block Structure
The plugin uses the WordPress block editor to manage content for the infographic. The block is registered with the following metadata:
- Description: A block that lets you create accessible infographics from simply uploading an image.
- Block Name:
visua11y/visua11y-infographic - Version: 0.1.0
- Category: Media
- Icon:
chart-pie
Developer Notes
The plugin leverages several WordPress components and React libraries:
- Accessible Alternative Generation: The API generates an accessible alternative (summary, data table, context), which can be edited and inserted as core blocks.
- Block Registration: The block is registered using
registerBlockTypefrom@wordpress/blocks. - Editor Scripts and Styles: The editor’s functionality is powered by the
index.js,edit.js, andsave.jsfiles. The block’s appearance is styled using theeditor.scssandstyle.scssfiles. - Image Upload: The
MediaUploadcomponent allows users to upload an image, which is then processed by the AI API.
Alternative Infographic Block in Action
Below, it can be found how the alternative for the infographic is displayed, including Summary, Context and Values, in a block layout.
Accessible alternative for the infographic
Summary
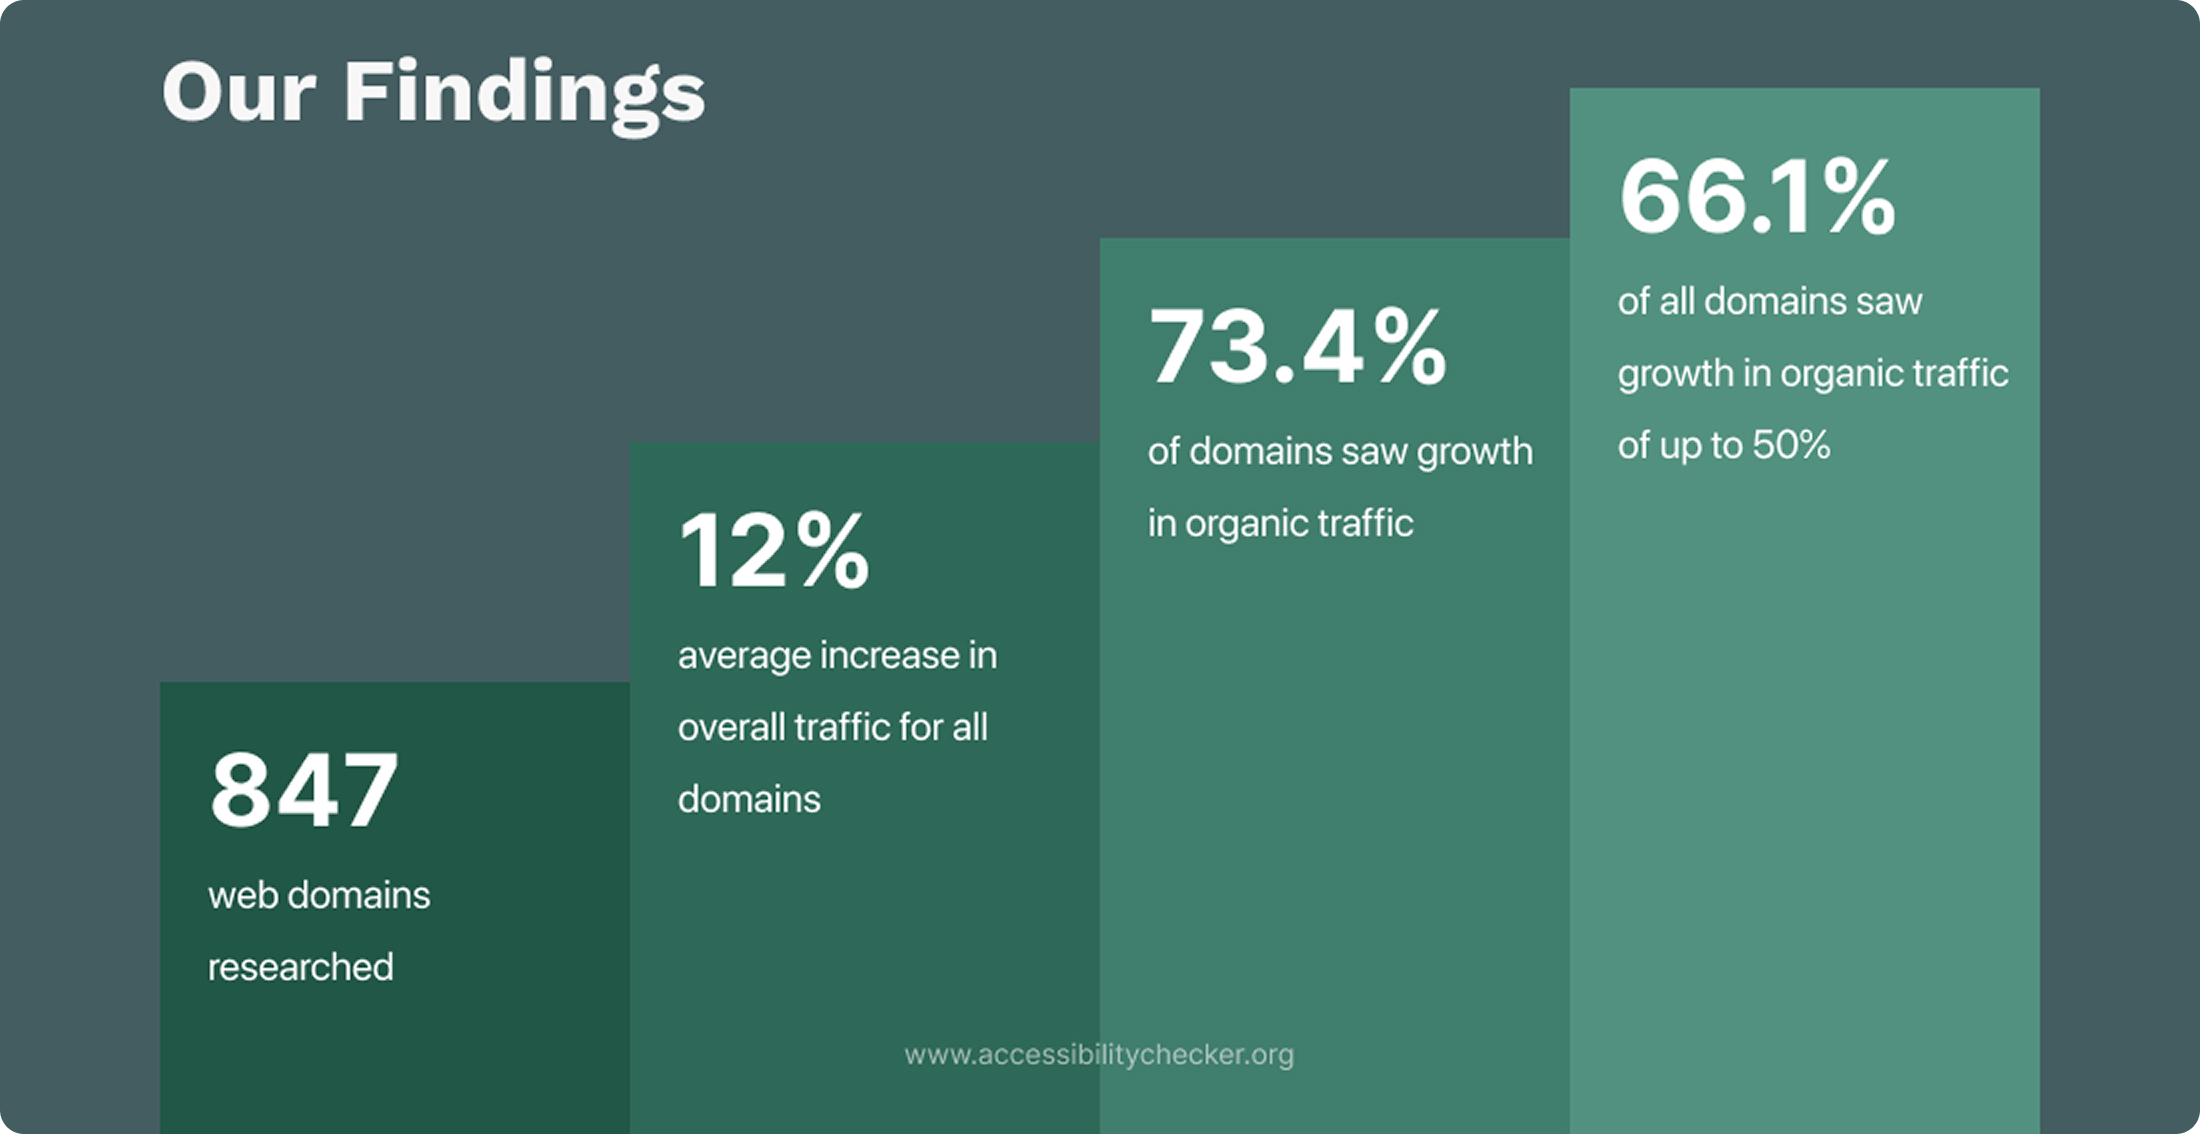
This bar chart presents findings from research on web domains, highlighting key statistics related to traffic changes. It indicates that a total of 847 web domains were researched. The chart shows a 12% average increase in overall traffic across all domains. Additionally, 73.4% of the domains experienced growth in organic traffic, while 66.1% saw this growth reach up to 50%. These insights suggest overall positive trends in web traffic for the analyzed domains.
Values
| Finding | Percentage or Total |
|---|---|
| Web domains researched | 847 |
| Average increase in overall traffic | 12% |
| Domains with growth in organic traffic | 73.4% |
| Domains with growth up to 50% | 66.1% |
Context
The bar chart effectively uses varying heights to represent the different statistics, providing a clear visual comparison of each finding. The first bar represents the total number of web domains, followed by bars illustrating the percentage increase in overall traffic and the proportions of domains experiencing organic traffic growth.