Processed examples
The images below have been run through our WordPress plugin.
Amazon, size chart
Accessible alternative for the infographic
Summary
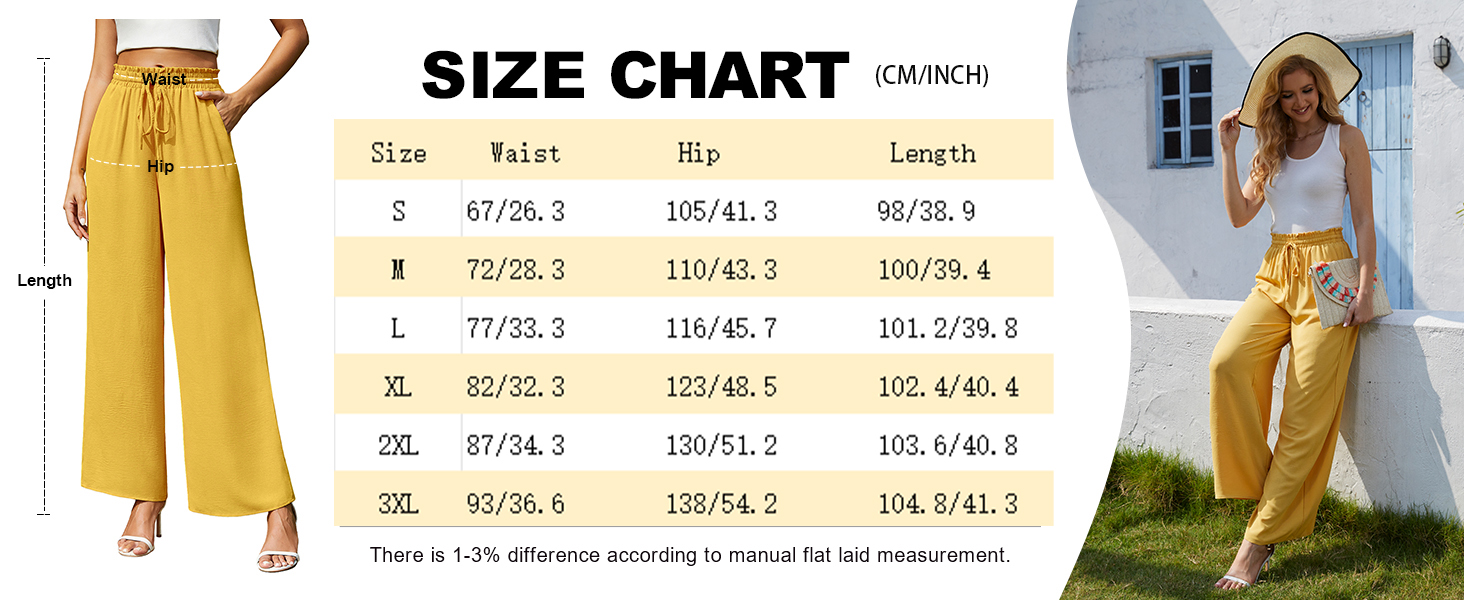
This size chart provides measurements for various sizes of pants, including waist, hip, and length dimensions in both centimeters and inches. It aims to help customers find their appropriate size before purchasing.
Values
| Size | Waist (cm/in) | Hip (cm/in) | Length (cm/in) |
|---|---|---|---|
| S | 67 / 26.3 | 105 / 41.3 | 98 / 38.9 |
| M | 72 / 28.3 | 110 / 43.3 | 100 / 39.4 |
| L | 77 / 30.3 | 116 / 45.7 | 101 / 39.8 |
| XL | 82 / 32.3 | 123 / 48.5 | 102 / 40.4 |
| 2XL | 87 / 34.3 | 130 / 51.2 | 103 / 40.6 |
| 3XL | 93 / 36.6 | 138 / 54.2 | 104 / 41.3 |
Context
The chart includes a note indicating a 1-3% difference due to manual flat laid measurements. Each size is represented with corresponding waist, hip, and length measurements, assisting customers in selecting their ideal fit.
2024 Research on the impact of accessibility on SEO
In August 2024, Accessibilitychecker.org published the results of their research about the conducted in conjunction with SEMrush and BuiltWith. They created a detailed report to outline whether accessibility has a positive impact on SEO. They repeated this research on ten thousand websites in 2025, the stat for that is further down below.
Here’s the screenshot of their 2024 stats.
Accessible alternative for the infographic
Summary
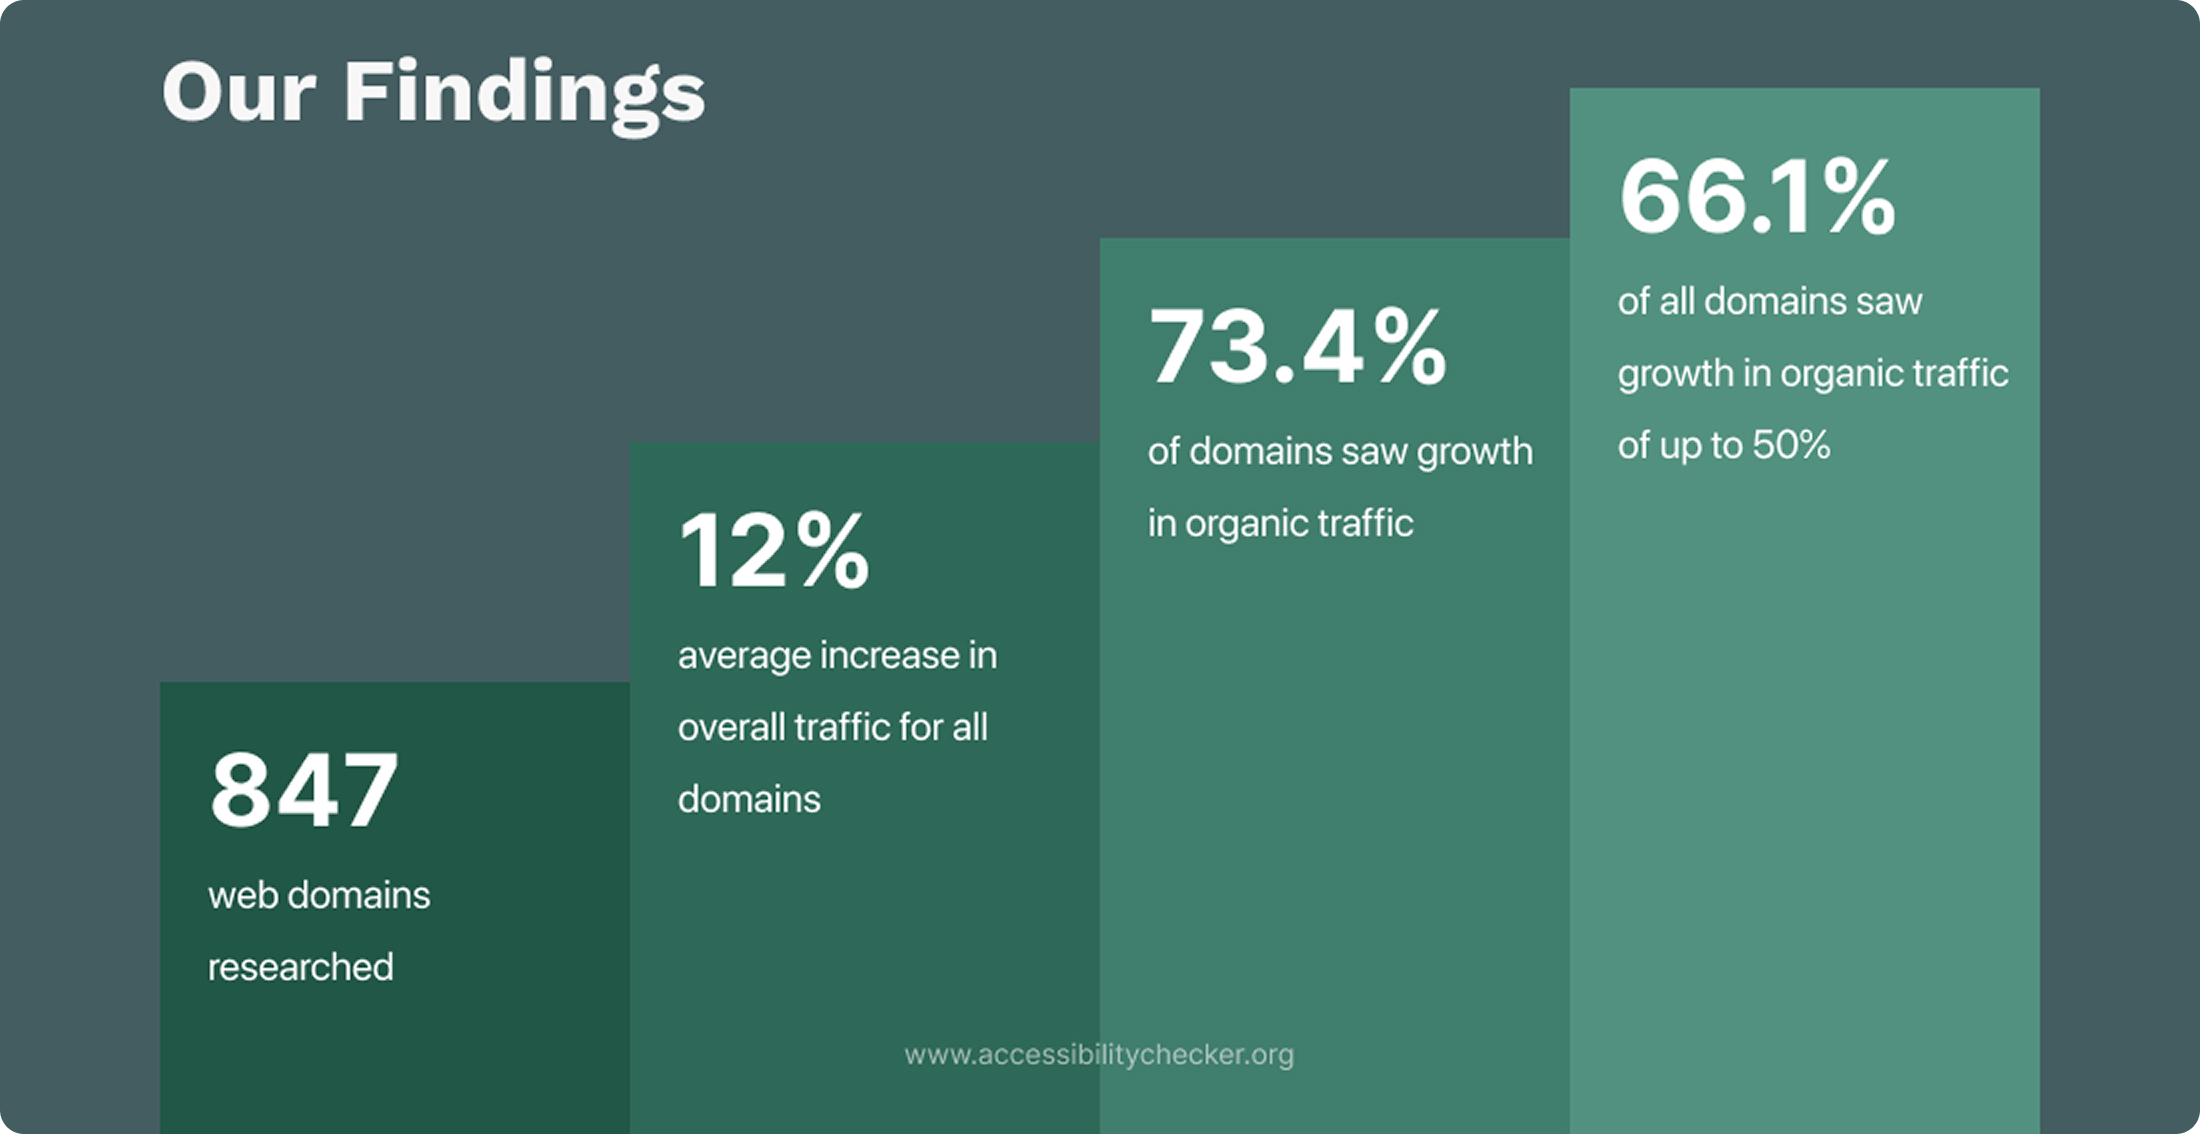
The bar chart presents findings from research on web domains, highlighting key statistics about traffic growth. It indicates that out of 847 domains researched, there was an average overall traffic increase of 12%. Additionally, 73.4% of domains experienced growth in organic traffic, and 66.1% of these domains saw growth of up to 50%.
Values
| Category | Value |
|---|---|
| Web domains researched | 847 |
| Average increase in overall traffic for all domains | 12% |
| Percentage of domains that saw growth in organic traffic | 73.4% |
| Percentage of domains with growth of up to 50% | 66.1% |
Context
The bar chart visually emphasizes the key findings, with each bar representing different metrics related to web domain traffic. The heights of the bars correspond to the percentages and numbers provided, facilitating easy comparison across the different categories.
2025 Research on the impact of accessibility on SEO
Here are the results from the 20025 research.
Accessible alternative for the infographic
Summary
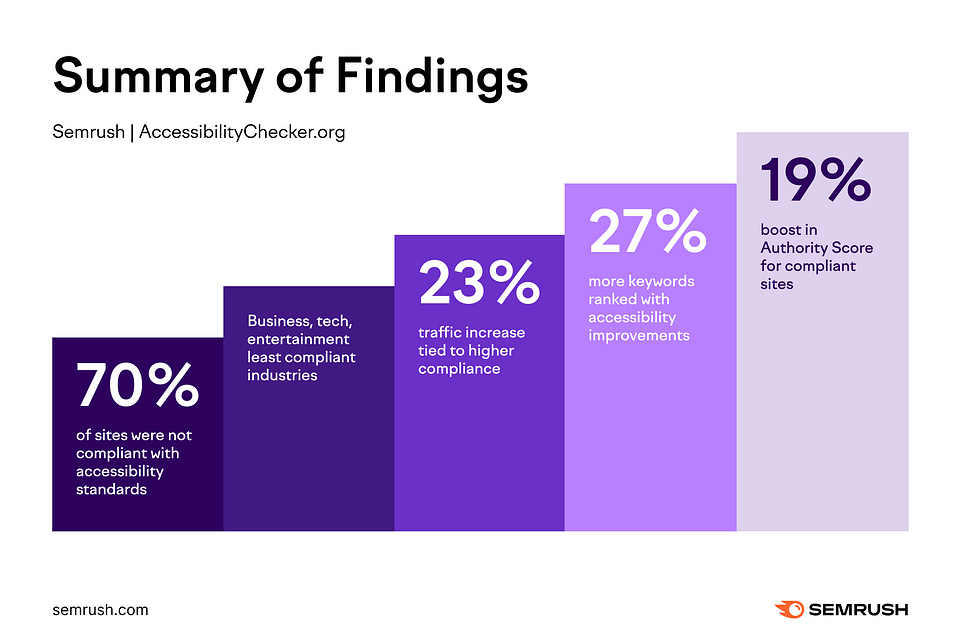
This bar chart illustrates findings related to website accessibility compliance, highlighting key statistics on compliance rates, traffic increases, keyword rankings, and boosts in authority scores. Notably, it shows that 70% of sites are non-compliant with accessibility standards, while compliant sites experience significant benefits, including a 23% traffic increase and a 19% rise in Authority Score.
Values
| Category | Percentage |
|---|---|
| Sites not compliant with accessibility | 70% |
| Traffic increase tied to higher compliance | 23% |
| More keywords ranked with accessibility improvements | 27% |
| Boost in Authority Score for compliant sites | 19% |
Context
The bars are arranged vertically, each representing different statistics about website accessibility and its impacts. The data is color-coded to indicate varying degrees of compliance, with darker shades representing non-compliance and lighter shades indicating beneficial results from compliance.